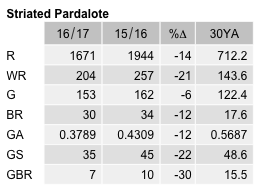
Striated Pardalote
Pardalotus striatus
ABR description
The following is extracted from the Annual Bird Report for the twelve months to June 2017.
Very common, breeding resident/migrant
Common in the tablelands and often heard in the suburbs.
General: Fewer records than last year and fewer birds seen (4856 cf 6719 last year). WOO records up on last year. Both the abundance measure and reporting rate have fallen to record lows, with the A value being 0.3431 and the reporting rate 12% both about half of the long-term averages. Mean 2.9, median 2, with max 45/10 Apr Belconnen Golf Course (CaR3). 32 breeding records from 21 grids commencing with ih/7 Aug Wanniassa Hills NR (CaR3) and last ny/13 Feb Ngunnawal (LeM1). Breeding reporting rate at a record low of 12%.
GBS: Indices now show some downward change over previous years: 487 records from 35 sites (59%), in all weeks. Abundance (A=0.3789) down 12% on last year. Mean 2, median 1 with max 24/3wk Aug Page (AlB1). 7 breeding records from 1 rural and 3 suburban sites: from ih/3wk Aug Watson (WaK1) to dy/1wk Mar Ainslie (HoS1).
Abundance
Abundance is the average number of birds of that species per survey. Where the species was observed (presence recorded) but the number of birds seen was not recorded, this is treated as a count of zero.
Abundance by year
This chart shows the abundance of Striated Pardalote between 1982 and 2017. 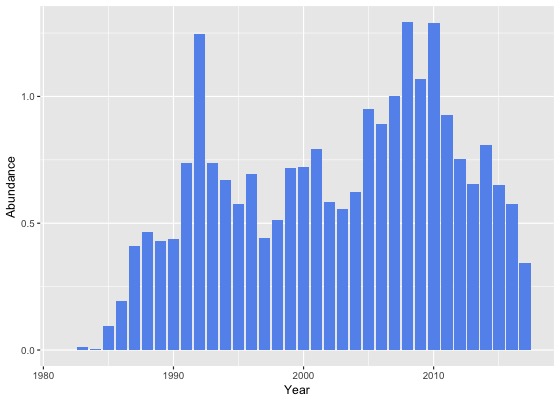
Abundance by month
This chart shows the monthly abundance of Striated Pardalote. The blue lines show the abundance for the twelve months to June 2017 and the bars show the average abundance for the period 1982 to 2017. 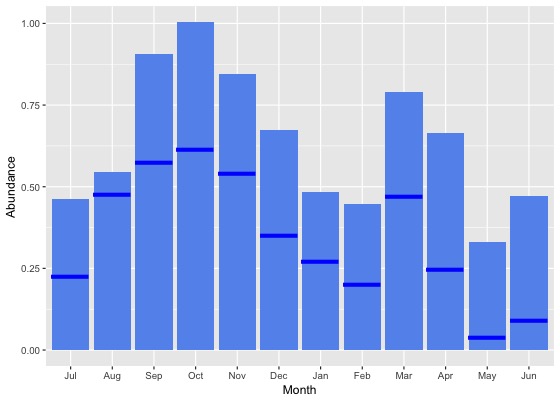
Abundance by season
This chart shows the seasonal abundance of Striated Pardalote. The blue lines show the seasonal abundance for the twelve months to June 2017 and the bars show the average seasonal abundance for the period 1982 to 2017. 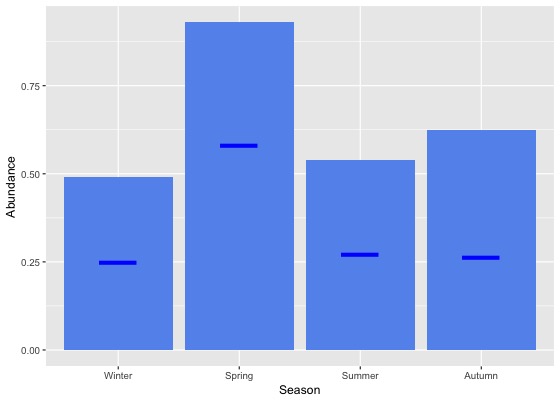
Abundance data
| Month | Season | ||||||||||||||||||
|---|---|---|---|---|---|---|---|---|---|---|---|---|---|---|---|---|---|---|---|
| Period | Jul | Aug | Sep | Oct | Nov | Dec | Jan | Feb | Mar | Apr | May | Jun | Winter | Spring | Summer | Autumn | All | ||
| All years | |||||||||||||||||||
| All | 0.5 | 0.5 | 0.9 | 1.0 | 0.8 | 0.7 | 0.5 | 0.4 | 0.8 | 0.7 | 0.3 | 0.5 | 0.5 | 0.9 | 0.5 | 0.6 | 0.7 | ||
| Previous years | |||||||||||||||||||
| All previous years | 0.5 | 0.6 | 1.0 | 1.1 | 0.9 | 0.7 | 0.5 | 0.5 | 0.8 | 0.7 | 0.4 | 0.5 | 0.5 | 1.0 | 0.6 | 0.7 | 0.7 | ||
| Previous 30 years | 0.5 | 0.6 | 1.0 | 1.1 | 0.9 | 0.7 | 0.5 | 0.5 | 0.9 | 0.7 | 0.4 | 0.6 | 0.5 | 1.0 | 0.6 | 0.7 | 0.7 | ||
| Previous 20 years | 0.6 | 0.6 | 1.0 | 1.1 | 1.0 | 0.8 | 0.5 | 0.5 | 0.9 | 0.8 | 0.4 | 0.6 | 0.6 | 1.0 | 0.6 | 0.7 | 0.8 | ||
| 10 year groups | |||||||||||||||||||
| [2007,2017) | 0.5 | 0.6 | 1.1 | 1.2 | 1.0 | 0.8 | 0.5 | 0.6 | 0.9 | 0.8 | 0.4 | 0.6 | 0.5 | 1.1 | 0.6 | 0.8 | 0.8 | ||
| [1997,2007) | 0.7 | 0.7 | 0.9 | 0.8 | 0.9 | 0.7 | 0.5 | 0.5 | 0.8 | 0.7 | 0.5 | 0.7 | 0.7 | 0.9 | 0.6 | 0.7 | 0.7 | ||
| [1987,1997) | 0.3 | 0.5 | 0.8 | 0.9 | 0.7 | 0.6 | 0.6 | 0.4 | 0.6 | 0.5 | 0.3 | 0.3 | 0.4 | 0.8 | 0.6 | 0.5 | 0.6 | ||
| 5 year groups | |||||||||||||||||||
| [2012,2017) | 0.4 | 0.5 | 0.9 | 1.1 | 0.8 | 0.7 | 0.4 | 0.5 | 0.8 | 0.6 | 0.4 | 0.5 | 0.5 | 0.9 | 0.5 | 0.6 | 0.7 | ||
| [2007,2012) | 0.9 | 0.6 | 1.4 | 1.4 | 1.6 | 1.0 | 1.0 | 0.8 | 1.4 | 1.2 | 0.5 | 0.6 | 0.7 | 1.4 | 0.9 | 1.1 | 1.1 | ||
| [2002,2007) | 0.8 | 0.8 | 1.0 | 0.7 | 1.0 | 0.6 | 0.3 | 0.5 | 0.8 | 0.6 | 0.6 | 0.8 | 0.8 | 0.9 | 0.5 | 0.7 | 0.7 | ||
| [1997,2002) | 0.4 | 0.6 | 0.8 | 1.0 | 0.9 | 0.7 | 0.6 | 0.5 | 0.8 | 0.8 | 0.5 | 0.5 | 0.5 | 0.9 | 0.6 | 0.7 | 0.7 | ||
| [1992,1997) | 0.5 | 0.7 | 1.2 | 1.5 | 0.9 | 0.9 | 0.7 | 0.4 | 0.8 | 0.6 | 0.3 | 0.3 | 0.5 | 1.2 | 0.7 | 0.6 | 0.8 | ||
| [1987,1992) | 0.2 | 0.4 | 0.6 | 0.5 | 0.6 | 0.5 | 0.5 | 0.4 | 0.5 | 0.5 | 0.3 | 0.3 | 0.3 | 0.6 | 0.5 | 0.5 | 0.5 | ||
| Year | |||||||||||||||||||
| 2017 | 0.2 | 0.5 | 0.6 | 0.6 | 0.5 | 0.4 | 0.3 | 0.2 | 0.5 | 0.2 | 0.0 | 0.1 | 0.2 | 0.6 | 0.3 | 0.3 | 0.3 | ||
| 2016 | 0.3 | 0.3 | 0.8 | 1.1 | 0.7 | 0.5 | 0.4 | 0.4 | 0.9 | 0.6 | 0.2 | 0.3 | 0.3 | 0.9 | 0.4 | 0.6 | 0.6 | ||
| 2015 | 0.6 | 0.9 | 0.9 | 1.1 | 0.5 | 0.6 | 0.4 | 0.6 | 0.4 | 1.0 | 0.4 | 0.3 | 0.5 | 0.9 | 0.5 | 0.6 | 0.7 | ||
| 2014 | 0.4 | 0.8 | 0.8 | 0.8 | 1.0 | 0.8 | 0.6 | 1.0 | 1.4 | 0.4 | 0.5 | 0.9 | 0.8 | 0.8 | 0.8 | 0.9 | 0.8 | ||
| 2013 | 0.2 | 0.5 | 0.9 | 1.2 | 1.1 | 0.8 | 0.3 | 0.2 | 0.5 | 0.5 | 0.6 | 0.6 | 0.4 | 1.1 | 0.5 | 0.5 | 0.7 | ||
| 2012 | 0.2 | 0.6 | 1.1 | 1.1 | 1.1 | 1.2 | 0.2 | 0.4 | 0.5 | 0.6 | 0.3 | 1.0 | 0.6 | 1.1 | 0.6 | 0.5 | 0.8 | ||
| 2011 | 1.2 | 1.0 | 1.1 | 1.6 | 1.2 | 0.6 | 1.2 | 0.6 | 1.4 | 0.6 | 0.2 | 0.4 | 0.7 | 1.4 | 0.8 | 0.7 | 0.9 | ||
| 2010 | 0.3 | 0.6 | 1.4 | 1.3 | 2.2 | 1.3 | 0.7 | 0.8 | 1.4 | 1.4 | 1.3 | 1.4 | 1.0 | 1.5 | 1.0 | 1.4 | 1.3 | ||
| 2009 | 1.3 | 0.7 | 1.5 | 1.4 | 1.8 | 1.0 | 0.8 | 0.7 | 1.1 | 0.8 | 0.2 | 0.2 | 0.7 | 1.5 | 0.8 | 0.8 | 1.1 | ||
| 2008 | 0.2 | 0.4 | 1.6 | 1.1 | 1.7 | 0.9 | 1.5 | 1.2 | 2.2 | 1.8 | 1.1 | 1.3 | 0.7 | 1.3 | 1.1 | 1.8 | 1.3 | ||
| 2007 | 1.4 | 0.4 | 1.6 | 1.6 | 0.9 | 1.1 | 0.6 | 0.7 | 1.1 | 1.4 | 0.2 | 0.1 | 0.4 | 1.5 | 0.8 | 1.0 | 1.0 | ||
| 2006 | 0.9 | 1.3 | 1.2 | 1.1 | 1.2 | 0.8 | 0.4 | 0.5 | 1.0 | 0.5 | 0.3 | 0.9 | 1.0 | 1.2 | 0.6 | 0.7 | 0.9 | ||
| 2005 | 2.9 | 0.6 | 1.2 | 0.4 | 0.8 | 0.7 | 0.4 | 1.1 | 0.9 | 0.4 | 0.8 | 1.2 | 1.6 | 0.8 | 0.7 | 0.7 | 0.9 | ||
| 2004 | 0.3 | 0.3 | 0.8 | 0.5 | 1.2 | 0.3 | 0.3 | 0.5 | 0.6 | 1.1 | 0.7 | 1.0 | 0.5 | 0.8 | 0.4 | 0.8 | 0.6 | ||
| 2003 | 0.3 | 1.0 | 0.8 | 0.5 | 0.6 | 0.5 | 0.3 | 0.2 | 1.0 | 0.5 | 0.6 | 0.1 | 0.4 | 0.6 | 0.4 | 0.7 | 0.6 | ||
| 2002 | 0.4 | 0.7 | 1.0 | 0.6 | 1.1 | 0.6 | 0.2 | 0.3 | 0.4 | 0.4 | 0.2 | 0.6 | 0.6 | 0.9 | 0.4 | 0.4 | 0.6 | ||
| 2001 | 0.2 | 0.4 | 0.8 | 1.4 | 1.1 | 1.4 | 0.8 | 0.6 | 0.9 | 0.7 | 0.4 | 0.6 | 0.4 | 1.0 | 1.0 | 0.7 | 0.8 | ||
| 2000 | 1.0 | 1.1 | 0.9 | 0.8 | 1.0 | 0.5 | 0.7 | 0.6 | 0.8 | 0.6 | 0.4 | 0.5 | 0.8 | 0.9 | 0.6 | 0.7 | 0.7 | ||
| 1999 | 0.0 | 0.5 | 0.8 | 0.9 | 0.6 | 0.7 | 0.7 | 0.5 | 0.8 | 1.2 | 0.4 | 0.8 | 0.7 | 0.8 | 0.6 | 0.8 | 0.7 | ||
| 1998 | 0.1 | 0.4 | 0.9 | 0.9 | 0.9 | 0.2 | 0.4 | 0.2 | 0.2 | 0.4 | 1.3 | 0.0 | 0.2 | 0.9 | 0.3 | 0.4 | 0.5 | ||
| 1997 | 0.0 | 0.2 | 0.3 | 0.8 | 0.7 | 0.3 | 0.2 | 0.1 | 1.3 | 1.0 | 0.3 | 0.2 | 0.1 | 0.5 | 0.2 | 0.9 | 0.4 | ||
| 1996 | 1.1 | 1.4 | 1.7 | 1.1 | 0.4 | 0.3 | 0.5 | 0.1 | 1.1 | 0.0 | 0.1 | 0.3 | 0.9 | 1.0 | 0.3 | 0.5 | 0.7 | ||
| 1995 | 0.5 | 0.3 | 0.2 | 0.9 | 0.6 | 0.3 | 0.5 | 0.5 | 0.9 | 1.0 | 0.2 | 0.7 | 0.5 | 0.6 | 0.4 | 0.8 | 0.6 | ||
| 1994 | 0.3 | 1.0 | 1.0 | 1.2 | 0.5 | 2.7 | 1.6 | 0.3 | 0.1 | 0.4 | 0.1 | 0.0 | 0.4 | 0.8 | 1.5 | 0.2 | 0.7 | ||
| 1993 | 0.2 | 0.7 | 1.1 | 1.4 | 1.1 | 1.5 | 0.8 | 0.2 | 0.9 | 0.6 | 0.3 | 0.0 | 0.3 | 1.2 | 0.9 | 0.6 | 0.7 | ||
| 1992 | 0.2 | 0.1 | 2.2 | 3.2 | 2.6 | 0.7 | 0.2 | 1.5 | 0.9 | 0.7 | 0.8 | 0.1 | 0.2 | 2.7 | 0.7 | 0.8 | 1.2 | ||
| 1991 | 0.2 | 0.3 | 1.1 | 0.6 | 1.7 | 0.7 | 0.8 | 0.8 | 0.5 | 0.7 | 0.7 | 1.0 | 0.4 | 1.1 | 0.8 | 0.7 | 0.7 | ||
| 1990 | 0.2 | 0.2 | 0.4 | 0.3 | 0.3 | 0.4 | 0.6 | 0.5 | 1.1 | 1.3 | 0.3 | 0.3 | 0.2 | 0.3 | 0.5 | 0.9 | 0.4 | ||
| 1989 | 0.2 | 0.4 | 0.6 | 0.6 | 0.5 | 0.6 | 0.6 | 0.4 | 0.4 | 0.3 | 0.2 | 0.1 | 0.3 | 0.6 | 0.5 | 0.3 | 0.4 | ||
| 1988 | 0.4 | 0.5 | 0.6 | 0.6 | 0.6 | 0.5 | 0.5 | 0.4 | 0.5 | 0.4 | 0.3 | 0.2 | 0.4 | 0.6 | 0.5 | 0.4 | 0.5 | ||
| 1987 | 0.5 | 0.2 | 0.4 | 0.5 | 0.5 | 0.5 | 0.5 | 0.3 | 0.4 | 0.4 | 0.3 | 0.3 | 0.3 | 0.5 | 0.4 | 0.4 | 0.4 | ||
| 1986 | 0.2 | 0.1 | 0.1 | 0.4 | 0.3 | 0.2 | 0.2 | 0.2 | 0.1 | 0.2 | 0.2 | 0.0 | 0.1 | 0.3 | 0.2 | 0.2 | 0.2 | ||
| 1985 | 0.0 | 0.1 | 0.5 | 0.0 | 0.1 | 0.0 | 0.1 | 0.1 | 0.2 | 0.0 | 0.1 | 0.0 | 0.0 | 0.2 | 0.0 | 0.1 | 0.1 | ||
| 1984 | 0.0 | 0.0 | 0.0 | 0.0 | 0.0 | 0.0 | 0.0 | 0.0 | 0.0 | 0.0 | 0.0 | 0.0 | 0.0 | 0.0 | 0.0 | 0.0 | 0.0 | ||
| 1983 | 0.0 | 0.0 | 0.0 | 0.0 | 0.1 | 0.0 | 0.0 | 0.0 | 0.0 | - | 0.0 | 0.0 | 0.0 | 0.0 | 0.0 | 0.0 | 0.0 | ||
| 1982 | - | 0.0 | - | 0.0 | 0.0 | 0.0 | - | 0.0 | - | 0.0 | - | 0.0 | 0.0 | 0.0 | 0.0 | 0.0 | 0.0 | ||
Reporting rates
Reporting rate is the proportion of all surveys in which the species was present.
Reporting rate by year
This chart shows the reporting rate of Striated Pardalote each year between 1982 and 2017. 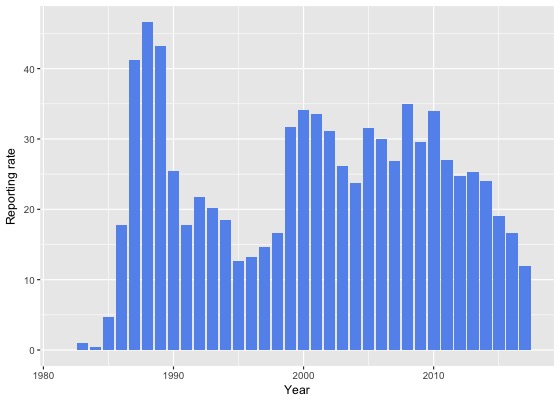
Reporting rate by month
This chart shows the reporting rate by month of Striated Pardalote. The blue lines show the reporting rate for the twelve months to June 2017 and the bars show the average reporting rate for the period 1982 to 2017. 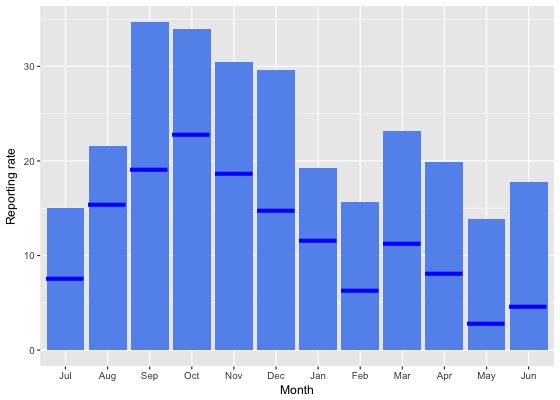
Reporting rate by season
This chart shows the seasonal reporting rate of Striated Pardalote. The blue lines show the seasonal reporting rate for the twelve months to June 2017 and the bars show the average seasonal reporting rate for the period 1982 to 2017. 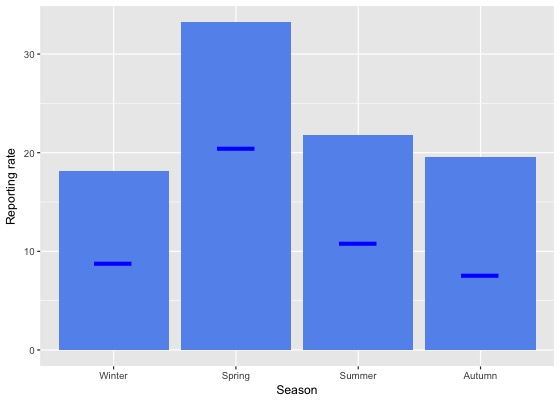
Reporting rate data
| Month | Season | ||||||||||||||||||
|---|---|---|---|---|---|---|---|---|---|---|---|---|---|---|---|---|---|---|---|
| Period | Jul | Aug | Sep | Oct | Nov | Dec | Jan | Feb | Mar | Apr | May | Jun | Winter | Spring | Summer | Autumn | All | ||
| All years | |||||||||||||||||||
| All | 15.1 | 21.5 | 34.6 | 33.9 | 30.5 | 29.6 | 19.3 | 15.6 | 23.2 | 19.8 | 13.9 | 17.8 | 18.2 | 33.2 | 21.8 | 19.5 | 23.8 | ||
| Previous years | |||||||||||||||||||
| All previous years | 16.2 | 22.7 | 36.8 | 35.4 | 32.4 | 31.8 | 20.7 | 17.6 | 25.3 | 21.7 | 16.4 | 20.3 | 19.9 | 35.0 | 23.8 | 21.8 | 25.9 | ||
| Previous 30 years | 16.3 | 23.0 | 37.3 | 35.8 | 32.7 | 32.3 | 20.8 | 17.8 | 25.4 | 21.9 | 16.5 | 20.6 | 20.1 | 35.4 | 24.1 | 21.9 | 26.1 | ||
| Previous 20 years | 15.5 | 20.9 | 36.8 | 35.0 | 30.3 | 31.0 | 18.1 | 15.4 | 24.6 | 21.0 | 15.5 | 21.4 | 19.6 | 34.4 | 22.0 | 21.1 | 25.0 | ||
| 10 year groups | |||||||||||||||||||
| [2007,2017) | 13.1 | 18.0 | 35.0 | 35.3 | 28.3 | 29.0 | 16.9 | 14.1 | 22.9 | 19.0 | 12.5 | 18.2 | 16.8 | 33.6 | 20.1 | 18.9 | 23.3 | ||
| [1997,2007) | 19.5 | 27.3 | 40.4 | 33.7 | 34.4 | 34.7 | 22.2 | 19.0 | 28.2 | 26.2 | 22.7 | 28.2 | 25.2 | 36.4 | 26.8 | 26.2 | 29.1 | ||
| [1987,1997) | 19.3 | 29.4 | 39.6 | 40.7 | 40.6 | 39.4 | 36.6 | 28.8 | 30.2 | 26.9 | 20.5 | 16.8 | 22.2 | 40.3 | 35.2 | 26.0 | 31.4 | ||
| 5 year groups | |||||||||||||||||||
| [2012,2017) | 11.8 | 17.2 | 31.7 | 32.8 | 25.4 | 25.5 | 15.5 | 12.8 | 19.6 | 16.0 | 11.4 | 15.6 | 15.0 | 30.6 | 17.7 | 16.3 | 20.5 | ||
| [2007,2012) | 17.0 | 21.0 | 42.5 | 39.7 | 36.5 | 36.6 | 22.0 | 19.5 | 32.0 | 25.7 | 15.6 | 22.8 | 21.0 | 39.8 | 27.8 | 25.7 | 30.2 | ||
| [2002,2007) | 20.1 | 28.9 | 42.4 | 31.4 | 32.2 | 34.1 | 15.7 | 16.2 | 29.5 | 25.6 | 22.3 | 30.8 | 26.7 | 35.5 | 24.3 | 26.5 | 28.6 | ||
| [1997,2002) | 18.7 | 25.4 | 38.0 | 37.2 | 36.9 | 35.6 | 29.4 | 21.9 | 26.4 | 26.9 | 23.4 | 24.7 | 23.2 | 37.4 | 29.8 | 25.8 | 29.6 | ||
| [1992,1997) | 10.5 | 15.3 | 20.9 | 22.1 | 26.0 | 20.5 | 17.4 | 14.0 | 15.2 | 13.7 | 10.6 | 8.0 | 11.4 | 23.1 | 17.5 | 13.3 | 16.6 | ||
| [1987,1992) | 23.3 | 37.2 | 48.4 | 50.9 | 47.6 | 47.7 | 47.2 | 34.5 | 39.1 | 34.4 | 25.7 | 21.8 | 27.8 | 48.9 | 43.2 | 33.2 | 39.0 | ||
| Year | |||||||||||||||||||
| 2017 | 7.6 | 15.5 | 19.1 | 22.8 | 18.7 | 14.8 | 11.6 | 6.3 | 11.3 | 8.2 | 2.9 | 4.6 | 8.8 | 20.4 | 10.8 | 7.6 | 12.0 | ||
| 2016 | 9.2 | 8.9 | 23.3 | 29.3 | 20.8 | 17.5 | 13.5 | 13.3 | 18.7 | 16.2 | 9.7 | 10.4 | 9.5 | 25.2 | 14.5 | 15.4 | 16.7 | ||
| 2015 | 15.9 | 26.2 | 33.7 | 31.9 | 19.9 | 23.1 | 14.4 | 11.1 | 15.3 | 14.5 | 9.8 | 10.1 | 16.1 | 29.1 | 16.1 | 13.5 | 19.1 | ||
| 2014 | 10.9 | 20.2 | 37.7 | 32.5 | 34.8 | 32.5 | 17.9 | 14.3 | 25.3 | 15.1 | 17.3 | 24.8 | 20.5 | 34.5 | 19.8 | 20.0 | 24.1 | ||
| 2013 | 13.6 | 23.5 | 40.6 | 36.2 | 36.2 | 30.9 | 18.2 | 12.0 | 21.4 | 15.6 | 13.4 | 23.1 | 20.3 | 37.5 | 21.9 | 17.6 | 25.3 | ||
| 2012 | 10.3 | 19.3 | 34.0 | 37.4 | 26.5 | 35.0 | 15.8 | 14.1 | 21.4 | 20.1 | 12.8 | 22.6 | 17.9 | 33.9 | 21.8 | 19.1 | 24.7 | ||
| 2011 | 30.1 | 24.8 | 43.0 | 45.3 | 38.8 | 28.9 | 24.6 | 16.0 | 27.2 | 19.7 | 9.5 | 10.5 | 17.6 | 43.5 | 24.1 | 19.3 | 27.0 | ||
| 2010 | 10.4 | 21.9 | 38.2 | 37.5 | 39.7 | 35.6 | 20.3 | 21.2 | 38.2 | 32.3 | 29.4 | 45.4 | 32.6 | 38.2 | 27.9 | 34.3 | 34.0 | ||
| 2009 | 23.7 | 28.1 | 45.5 | 38.3 | 37.5 | 38.1 | 22.0 | 17.5 | 31.2 | 23.0 | 6.9 | 8.6 | 17.3 | 40.0 | 27.5 | 22.4 | 29.5 | ||
| 2008 | 6.2 | 16.5 | 47.9 | 35.7 | 34.2 | 42.3 | 29.4 | 25.9 | 43.5 | 28.9 | 28.8 | 50.9 | 28.9 | 38.8 | 34.9 | 33.3 | 34.9 | ||
| 2007 | 13.2 | 13.9 | 37.3 | 42.5 | 30.4 | 40.9 | 16.1 | 20.9 | 23.4 | 25.6 | 15.4 | 8.1 | 10.3 | 38.9 | 28.0 | 22.6 | 26.8 | ||
| 2006 | 27.6 | 32.0 | 38.8 | 36.8 | 32.1 | 44.1 | 16.9 | 18.5 | 26.7 | 24.7 | 15.9 | 32.6 | 31.0 | 36.4 | 27.2 | 23.9 | 30.1 | ||
| 2005 | 22.8 | 22.4 | 44.6 | 23.2 | 24.8 | 37.1 | 19.1 | 18.5 | 35.5 | 26.2 | 27.4 | 45.0 | 34.3 | 33.3 | 28.3 | 30.1 | 31.5 | ||
| 2004 | 11.5 | 19.1 | 37.5 | 24.4 | 24.4 | 23.5 | 13.3 | 17.2 | 26.9 | 31.9 | 19.4 | 33.1 | 19.8 | 29.3 | 18.7 | 27.2 | 23.8 | ||
| 2003 | 15.4 | 38.1 | 41.1 | 29.0 | 31.7 | 30.5 | 17.8 | 13.2 | 30.9 | 24.0 | 22.5 | 6.2 | 19.4 | 34.3 | 21.7 | 26.4 | 26.2 | ||
| 2002 | 26.9 | 33.9 | 50.2 | 35.6 | 45.0 | 36.0 | 11.9 | 15.8 | 28.2 | 21.4 | 23.5 | 27.4 | 28.8 | 43.2 | 25.4 | 24.9 | 31.1 | ||
| 2001 | 12.9 | 22.3 | 38.9 | 47.5 | 48.3 | 61.6 | 34.0 | 24.2 | 26.8 | 24.9 | 22.5 | 27.1 | 20.4 | 43.8 | 42.5 | 25.2 | 33.5 | ||
| 2000 | 45.2 | 39.2 | 52.1 | 43.2 | 47.2 | 27.1 | 31.0 | 23.8 | 34.3 | 27.4 | 20.0 | 18.8 | 32.7 | 47.4 | 27.4 | 28.9 | 34.1 | ||
| 1999 | 8.8 | 18.6 | 40.8 | 35.8 | 31.2 | 28.1 | 32.8 | 29.3 | 23.2 | 38.1 | 30.7 | 36.4 | 28.7 | 36.1 | 30.0 | 30.8 | 31.6 | ||
| 1998 | 8.1 | 24.5 | 27.6 | 14.1 | 23.9 | 17.0 | 16.2 | 5.7 | 12.9 | 7.7 | 14.8 | 6.7 | 12.7 | 22.6 | 14.1 | 11.9 | 16.6 | ||
| 1997 | 3.4 | 10.3 | 14.5 | 18.4 | 20.5 | 21.2 | 11.8 | 3.5 | 20.0 | 16.5 | 11.1 | 16.7 | 9.7 | 17.8 | 14.2 | 16.0 | 14.7 | ||
| 1996 | 11.9 | 14.9 | 28.0 | 19.3 | 17.6 | 15.2 | 10.7 | 7.1 | 8.8 | 1.6 | 5.2 | 11.5 | 12.9 | 20.9 | 11.1 | 5.8 | 13.2 | ||
| 1995 | 6.5 | 7.0 | 12.6 | 14.0 | 17.3 | 10.3 | 15.9 | 11.1 | 16.3 | 14.5 | 7.8 | 16.0 | 9.5 | 14.6 | 12.9 | 13.4 | 12.7 | ||
| 1994 | 13.7 | 26.0 | 30.9 | 32.6 | 27.9 | 26.1 | 23.5 | 17.2 | 8.0 | 14.5 | 3.8 | 0.0 | 12.4 | 30.0 | 22.1 | 9.7 | 18.5 | ||
| 1993 | 10.2 | 21.8 | 16.1 | 25.3 | 37.9 | 41.3 | 26.5 | 12.5 | 22.2 | 15.0 | 10.4 | 4.3 | 12.8 | 26.6 | 28.3 | 16.1 | 20.2 | ||
| 1992 | 12.3 | 11.1 | 20.0 | 27.7 | 37.5 | 23.8 | 17.2 | 29.3 | 23.9 | 22.0 | 25.0 | 6.7 | 10.1 | 27.9 | 22.8 | 23.8 | 21.8 | ||
| 1991 | 14.2 | 8.5 | 19.8 | 25.2 | 21.6 | 14.9 | 21.4 | 18.0 | 17.5 | 22.0 | 16.4 | 16.0 | 12.5 | 22.4 | 17.8 | 18.6 | 17.8 | ||
| 1990 | 16.1 | 22.2 | 37.6 | 25.5 | 31.8 | 40.3 | 37.5 | 28.2 | 25.0 | 17.9 | 17.8 | 15.8 | 18.8 | 31.5 | 35.3 | 20.4 | 25.4 | ||
| 1989 | 18.9 | 44.4 | 57.6 | 62.7 | 49.5 | 57.0 | 59.6 | 37.1 | 39.4 | 35.4 | 21.7 | 15.5 | 27.9 | 57.2 | 51.5 | 32.8 | 43.2 | ||
| 1988 | 36.6 | 51.1 | 58.4 | 60.5 | 56.1 | 52.8 | 47.7 | 43.4 | 54.5 | 41.7 | 25.8 | 23.2 | 38.2 | 58.2 | 48.2 | 40.7 | 46.6 | ||
| 1987 | 27.3 | 40.0 | 46.6 | 49.2 | 51.6 | 46.9 | 45.6 | 31.2 | 36.4 | 36.6 | 33.2 | 29.4 | 30.0 | 49.4 | 40.7 | 35.4 | 41.2 | ||
| 1986 | 15.4 | 13.2 | 9.4 | 27.8 | 31.9 | 23.5 | 13.0 | 16.7 | 9.7 | 21.6 | 20.7 | 5.7 | 11.1 | 22.1 | 18.3 | 18.0 | 17.8 | ||
| 1985 | 0.0 | 6.7 | 5.8 | 2.3 | 5.3 | 1.7 | 12.5 | 5.9 | 18.2 | 0.0 | 20.0 | 7.1 | 4.5 | 4.1 | 3.5 | 10.0 | 4.7 | ||
| 1984 | 0.0 | 0.0 | 0.0 | 0.0 | 0.0 | 0.0 | 0.0 | 0.0 | 3.7 | 0.0 | 0.0 | 0.0 | 0.0 | 0.0 | 0.0 | 1.1 | 0.4 | ||
| 1983 | 0.0 | 0.0 | 0.0 | 0.0 | 11.1 | 0.0 | 0.0 | 0.0 | 0.0 | - | 0.0 | 0.0 | 0.0 | 3.7 | 0.0 | 0.0 | 1.0 | ||
| 1982 | - | 0.0 | - | 0.0 | 0.0 | 0.0 | - | 0.0 | - | 0.0 | - | 0.0 | 0.0 | 0.0 | 0.0 | 0.0 | 0.0 | ||
Breeding data
Breeding records by month
Number of breeding records by breeding code and month, 2017 and all years| Breeding code | Jul | Aug | Sep | Oct | Nov | Dec | Jan | Feb | Mar | Apr | May | Jun |
|---|---|---|---|---|---|---|---|---|---|---|---|---|
| 2017 | ||||||||||||
| Breeding (BLA code) | 0 | 0 | 0 | 0 | 0 | 0 | 0 | 0 | 0 | 0 | 0 | 0 |
| Carrying Food | 0 | 1 | 0 | 0 | 0 | 1 | 1 | 0 | 0 | 0 | 0 | 0 |
| Copulating | 0 | 0 | 0 | 0 | 0 | 0 | 0 | 0 | 0 | 0 | 0 | 0 |
| Display | 0 | 0 | 1 | 2 | 0 | 0 | 0 | 0 | 0 | 0 | 0 | 0 |
| Dependent young | 0 | 0 | 0 | 0 | 0 | 4 | 1 | 1 | 0 | 0 | 0 | 0 |
| Faecal sac | 0 | 0 | 0 | 0 | 1 | 0 | 0 | 0 | 0 | 0 | 0 | 0 |
| Inspecting hollow | 0 | 1 | 0 | 4 | 1 | 0 | 0 | 0 | 0 | 0 | 0 | 0 |
| Nest building | 0 | 0 | 0 | 0 | 0 | 0 | 0 | 0 | 0 | 0 | 0 | 0 |
| Nest with eggs | 0 | 0 | 0 | 0 | 0 | 0 | 0 | 0 | 0 | 0 | 0 | 0 |
| Nest with young | 0 | 0 | 0 | 0 | 0 | 1 | 3 | 1 | 0 | 0 | 0 | 0 |
| On/leaving nest | 0 | 1 | 0 | 4 | 1 | 1 | 1 | 0 | 0 | 0 | 0 | 0 |
| All years | ||||||||||||
| Breeding (BLA code) | 0 | 1 | 0 | 5 | 1 | 4 | 2 | 2 | 0 | 0 | 0 | 0 |
| Carrying Food | 0 | 1 | 0 | 9 | 7 | 5 | 5 | 1 | 0 | 0 | 0 | 0 |
| Copulating | 0 | 1 | 0 | 2 | 1 | 0 | 0 | 0 | 0 | 0 | 0 | 0 |
| Display | 0 | 1 | 8 | 9 | 2 | 2 | 2 | 0 | 0 | 0 | 0 | 1 |
| Dependent young | 0 | 0 | 0 | 12 | 15 | 17 | 13 | 5 | 2 | 0 | 0 | 0 |
| Faecal sac | 0 | 0 | 0 | 0 | 1 | 0 | 0 | 0 | 0 | 0 | 0 | 0 |
| Inspecting hollow | 1 | 8 | 33 | 54 | 21 | 8 | 1 | 0 | 1 | 1 | 1 | 1 |
| Nest building | 1 | 5 | 23 | 32 | 30 | 6 | 3 | 1 | 1 | 0 | 0 | 0 |
| Nest with eggs | 1 | 0 | 0 | 0 | 3 | 0 | 0 | 0 | 0 | 0 | 0 | 0 |
| Nest with young | 0 | 0 | 3 | 14 | 16 | 12 | 15 | 6 | 1 | 1 | 0 | 0 |
| On/leaving nest | 1 | 2 | 9 | 64 | 22 | 16 | 5 | 1 | 0 | 0 | 0 | 0 |
Breeding records by year
Average number of breeding records per period by breeding code| Period | Breeding (BLA code) | Carrying Food | Copulating | Display | Dependent young | Faecal sac | Inspecting hollow | Nest building | Nest with eggs | Nest with young | On/leaving nest |
|---|---|---|---|---|---|---|---|---|---|---|---|
| All years | |||||||||||
| All | 0.4 | 0.8 | 0.1 | 0.7 | 1.8 | 0.0 | 3.6 | 2.8 | 0.1 | 1.9 | 3.3 |
| Previous years | |||||||||||
| All previous years | 0.4 | 0.7 | 0.1 | 0.6 | 1.7 | 0.0 | 3.5 | 2.9 | 0.1 | 1.8 | 3.2 |
| Previous 30 years | 0.5 | 0.8 | 0.1 | 0.7 | 1.9 | 0.0 | 4.1 | 3.4 | 0.1 | 2.1 | 3.7 |
| Previous 20 years | 0.8 | 0.6 | 0.2 | 1.1 | 1.6 | 0.0 | 5.7 | 1.9 | 0.1 | 1.1 | 5.5 |
| 10 year groups | |||||||||||
| [2007,2017) | 1.0 | 0.8 | 0.3 | 1.3 | 1.9 | 0.0 | 7.7 | 2.7 | 0.0 | 1.8 | 8.0 |
| [1997,2007) | 0.5 | 0.3 | 0.1 | 0.9 | 1.3 | 0.0 | 3.6 | 1.2 | 0.2 | 0.5 | 3.0 |
| [1987,1997) | 0.0 | 1.4 | 0.0 | 0.0 | 2.6 | 0.0 | 1.1 | 6.3 | 0.2 | 4.0 | 0.2 |
| 5 year groups | |||||||||||
| [2012,2017) | 0.8 | 0.6 | 0.4 | 2.0 | 2.6 | 0.0 | 9.4 | 3.0 | 0.0 | 1.6 | 8.6 |
| [2007,2012) | 1.2 | 1.0 | 0.2 | 0.6 | 1.2 | 0.0 | 6.0 | 2.4 | 0.0 | 2.0 | 7.4 |
| [2002,2007) | 0.6 | 0.6 | 0.0 | 1.2 | 1.8 | 0.0 | 4.0 | 1.6 | 0.4 | 0.2 | 3.2 |
| [1997,2002) | 0.4 | 0.0 | 0.2 | 0.6 | 0.8 | 0.0 | 3.2 | 0.8 | 0.0 | 0.8 | 2.8 |
| [1992,1997) | 0.0 | 0.4 | 0.0 | 0.0 | 0.6 | 0.0 | 1.4 | 1.0 | 0.0 | 0.8 | 0.4 |
| [1987,1992) | 0.0 | 2.4 | 0.0 | 0.0 | 4.6 | 0.0 | 0.8 | 11.6 | 0.4 | 7.2 | 0.0 |
| Year | |||||||||||
| 2017 | 0.0 | 3.0 | 0.0 | 3.0 | 6.0 | 1.0 | 6.0 | 0.0 | 0.0 | 5.0 | 8.0 |
| 2016 | 1.0 | 1.0 | 1.0 | 3.0 | 2.0 | 0.0 | 13.0 | 3.0 | 0.0 | 1.0 | 9.0 |
| 2015 | 0.0 | 0.0 | 1.0 | 3.0 | 2.0 | 0.0 | 3.0 | 5.0 | 0.0 | 3.0 | 9.0 |
| 2014 | 0.0 | 0.0 | 0.0 | 1.0 | 5.0 | 0.0 | 11.0 | 4.0 | 0.0 | 4.0 | 8.0 |
| 2013 | 3.0 | 1.0 | 0.0 | 2.0 | 3.0 | 0.0 | 13.0 | 2.0 | 0.0 | 0.0 | 7.0 |
| 2012 | 0.0 | 1.0 | 0.0 | 1.0 | 1.0 | 0.0 | 7.0 | 1.0 | 0.0 | 0.0 | 10.0 |
| 2011 | 1.0 | 0.0 | 0.0 | 0.0 | 2.0 | 0.0 | 4.0 | 2.0 | 0.0 | 2.0 | 10.0 |
| 2010 | 0.0 | 2.0 | 0.0 | 0.0 | 1.0 | 0.0 | 10.0 | 4.0 | 0.0 | 1.0 | 11.0 |
| 2009 | 1.0 | 0.0 | 0.0 | 2.0 | 1.0 | 0.0 | 8.0 | 2.0 | 0.0 | 2.0 | 7.0 |
| 2008 | 4.0 | 2.0 | 1.0 | 0.0 | 1.0 | 0.0 | 3.0 | 1.0 | 0.0 | 5.0 | 9.0 |
| 2007 | 0.0 | 1.0 | 0.0 | 1.0 | 1.0 | 0.0 | 5.0 | 3.0 | 0.0 | 0.0 | 0.0 |
| 2006 | 1.0 | 0.0 | 0.0 | 4.0 | 6.0 | 0.0 | 5.0 | 1.0 | 0.0 | 1.0 | 2.0 |
| 2005 | 1.0 | 0.0 | 0.0 | 1.0 | 3.0 | 0.0 | 3.0 | 2.0 | 0.0 | 0.0 | 6.0 |
| 2004 | 1.0 | 0.0 | 0.0 | 1.0 | 0.0 | 0.0 | 4.0 | 3.0 | 0.0 | 0.0 | 4.0 |
| 2003 | 0.0 | 1.0 | 0.0 | 0.0 | 0.0 | 0.0 | 3.0 | 0.0 | 0.0 | 0.0 | 1.0 |
| 2002 | 0.0 | 2.0 | 0.0 | 0.0 | 0.0 | 0.0 | 5.0 | 2.0 | 2.0 | 0.0 | 3.0 |
| 2001 | 0.0 | 0.0 | 1.0 | 2.0 | 0.0 | 0.0 | 7.0 | 1.0 | 0.0 | 3.0 | 7.0 |
| 2000 | 2.0 | 0.0 | 0.0 | 0.0 | 1.0 | 0.0 | 5.0 | 1.0 | 0.0 | 0.0 | 1.0 |
| 1999 | 0.0 | 0.0 | 0.0 | 1.0 | 3.0 | 0.0 | 3.0 | 1.0 | 0.0 | 1.0 | 4.0 |
| 1998 | 0.0 | 0.0 | 0.0 | 0.0 | 0.0 | 0.0 | 0.0 | 0.0 | 0.0 | 0.0 | 1.0 |
| 1997 | 0.0 | 0.0 | 0.0 | 0.0 | 0.0 | 0.0 | 1.0 | 1.0 | 0.0 | 0.0 | 1.0 |
| 1996 | 0.0 | 0.0 | 0.0 | 0.0 | 0.0 | 0.0 | 3.0 | 1.0 | 0.0 | 0.0 | 0.0 |
| 1995 | 0.0 | 0.0 | 0.0 | 0.0 | 1.0 | 0.0 | 2.0 | 1.0 | 0.0 | 0.0 | 0.0 |
| 1994 | 0.0 | 0.0 | 0.0 | 0.0 | 0.0 | 0.0 | 0.0 | 2.0 | 0.0 | 4.0 | 2.0 |
| 1993 | 0.0 | 0.0 | 0.0 | 0.0 | 1.0 | 0.0 | 1.0 | 0.0 | 0.0 | 0.0 | 0.0 |
| 1992 | 0.0 | 2.0 | 0.0 | 0.0 | 1.0 | 0.0 | 1.0 | 1.0 | 0.0 | 0.0 | 0.0 |
| 1991 | 0.0 | 1.0 | 0.0 | 0.0 | 0.0 | 0.0 | 3.0 | 0.0 | 0.0 | 1.0 | 0.0 |
| 1990 | 0.0 | 0.0 | 0.0 | 0.0 | 0.0 | 0.0 | 0.0 | 3.0 | 1.0 | 3.0 | 0.0 |
| 1989 | 0.0 | 7.0 | 0.0 | 0.0 | 10.0 | 0.0 | 0.0 | 27.0 | 0.0 | 13.0 | 0.0 |
| 1988 | 0.0 | 4.0 | 0.0 | 0.0 | 7.0 | 0.0 | 1.0 | 23.0 | 1.0 | 6.0 | 0.0 |
| 1987 | 0.0 | 0.0 | 0.0 | 0.0 | 6.0 | 0.0 | 0.0 | 5.0 | 0.0 | 13.0 | 0.0 |
| 1986 | 0.0 | 0.0 | 0.0 | 0.0 | 0.0 | 0.0 | 0.0 | 0.0 | 0.0 | 0.0 | 0.0 |
| 1985 | 0.0 | 0.0 | 0.0 | 0.0 | 0.0 | 0.0 | 0.0 | 0.0 | 0.0 | 0.0 | 0.0 |
| 1984 | 0.0 | 0.0 | 0.0 | 0.0 | 0.0 | 0.0 | 0.0 | 0.0 | 0.0 | 0.0 | 0.0 |
| 1983 | 0.0 | 0.0 | 0.0 | 0.0 | 0.0 | 0.0 | 0.0 | 0.0 | 0.0 | 0.0 | 0.0 |
| 1982 | 0.0 | 0.0 | 0.0 | 0.0 | 0.0 | 0.0 | 0.0 | 0.0 | 0.0 | 0.0 | 0.0 |
Distribution map
Distribution - 2017
This map shows the observed distribution of the Striated Pardalote for 2017.
The red circles are the grid cells where Striated Pardalote have been reported.
The transparency of the red circles indicate how many surveys sheets were submitted for that grid cell; the darker the red the more reliable the data. Of the 315 grid cells with reports, 83 had only one sheet; an example is grid number E3.
The size of the circle represents the reporting rate. The maximum reporting rate for Striated Pardalote was 100.0% (eg grid number C2) and the minimum was 0.3% (eg grid number K14). 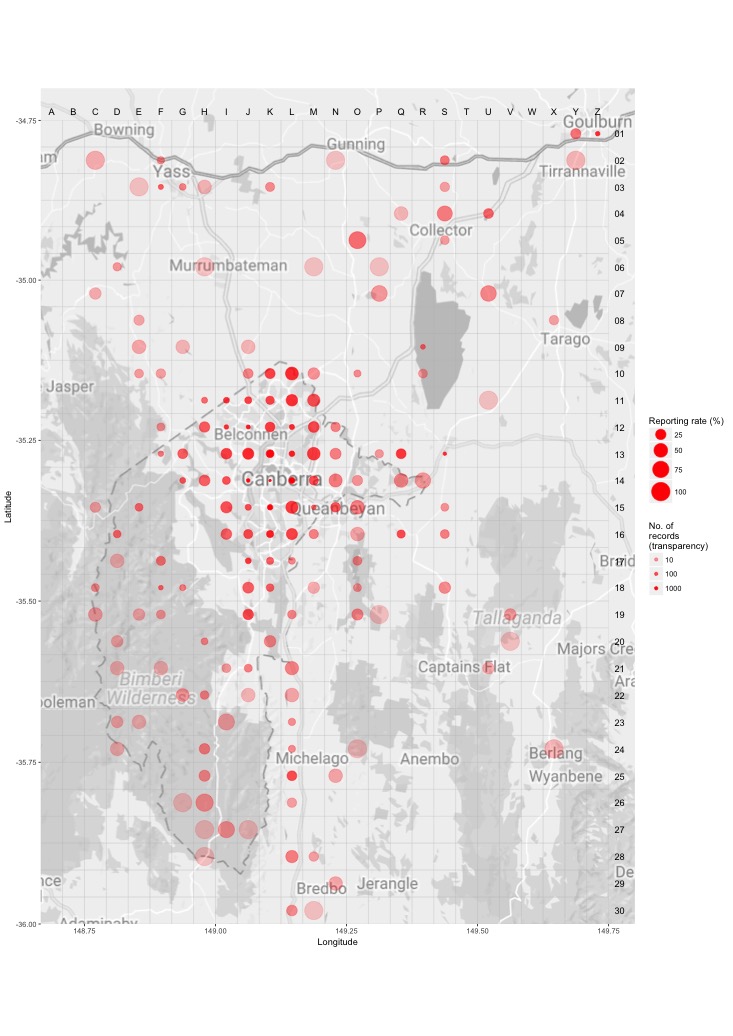
Distribution - all years
This map shows the observed distribution of the Striated Pardalote for all years.
The red circles are the grid cells where Striated Pardalote have been reported.
The transparency of the red circles indicate how many surveys sheets were submitted for that grid cell; the darker the red the more reliable the data. Of the 703 grid cells with reports, 55 had only one sheet; an example is grid number B2.
The size of the circle represents the reporting rate. The maximum reporting rate for Striated Pardalote was 100.0% (eg grid number A15) and the minimum was 1.2% (eg grid number S13). 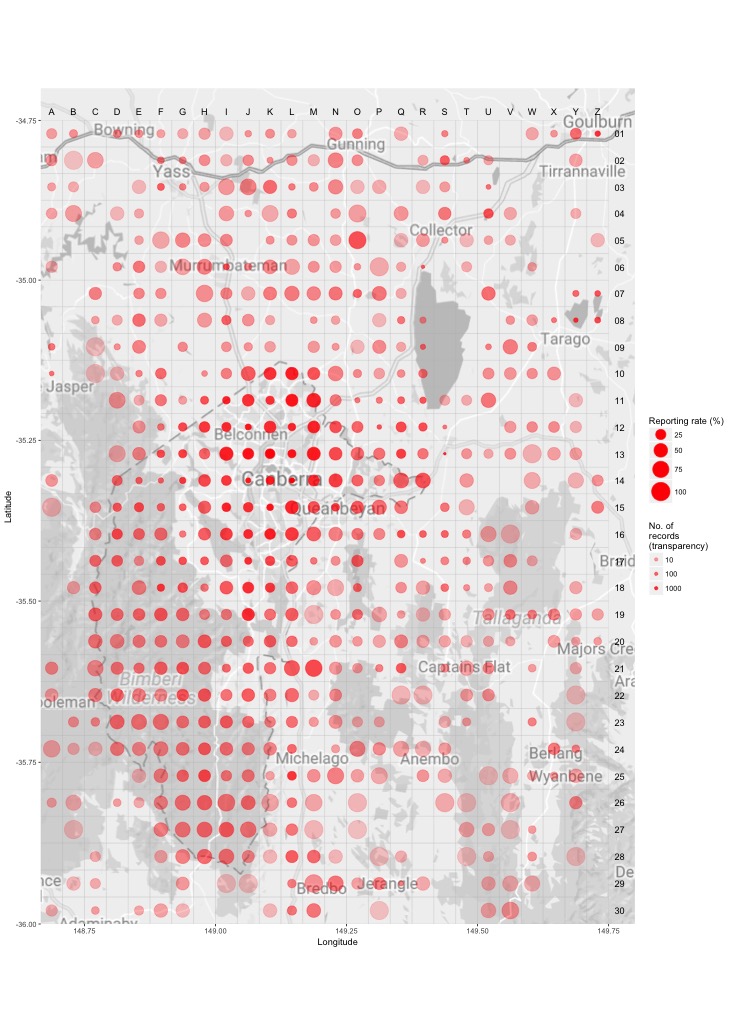
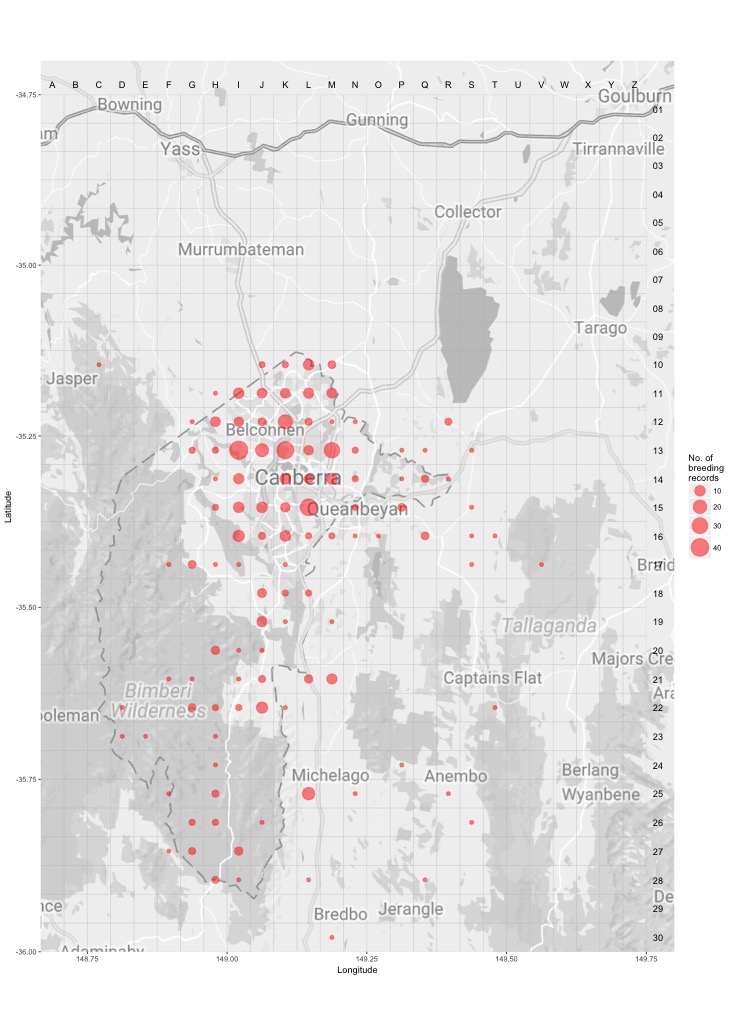
Breeding map
Breeding - 2017
This map shows the breeding distribution of the Striated Pardalote for 2017.
The red circles are the grid cells where breeding activity for Striated Pardalote have been reported.
The size of the circle represents the number of reports. 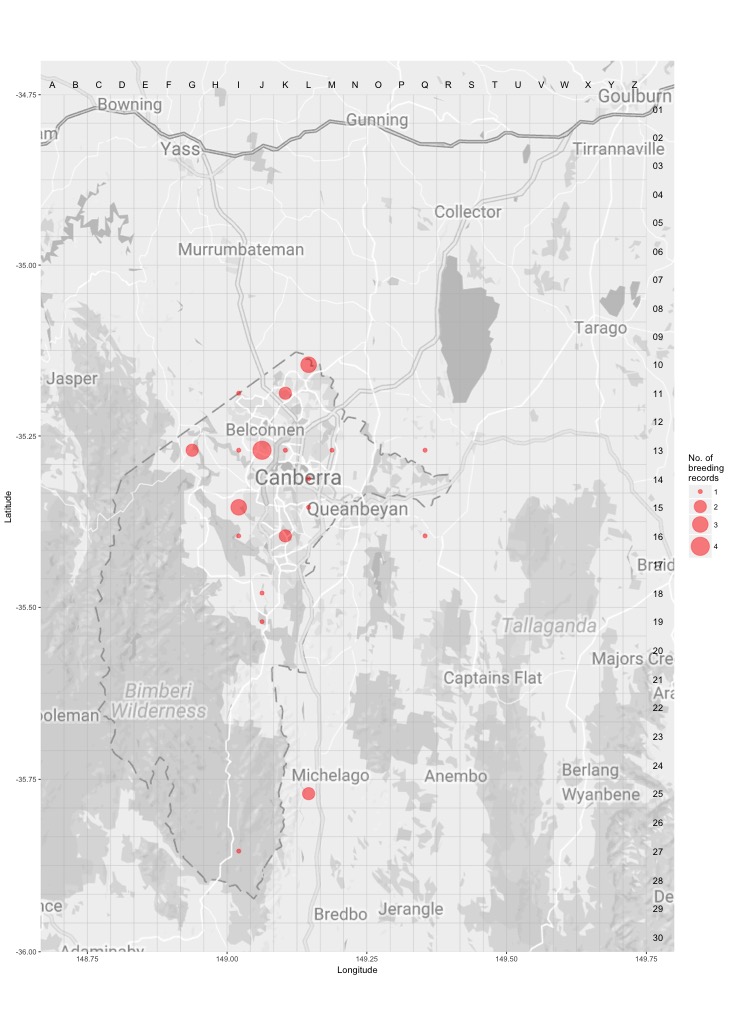
Breeding - all years
This map shows the breeding distribution of the Striated Pardalote for all years.
The red circles are the grid cells where breeding activity for Striated Pardalote have been reported.
The size of the circle represents the number of reports.